Sunday 2 November 2014

Literature and Discussion...

Last nite a got a furious question.. how can i write the discussion if i got lack of literature???  Ermm.. i think a lot how to answer this... i never thinking to write without literature... but how come she came out with this question???

For me.. the researcher will face a lot of problems if they dont have enough literature for what they have been studied. Why??

1) They need the literature to write the hypothesis

2) The discussion part also based on your literature.

It means ..without literature.. you will face to major problem which are literature review and the discussion... more on that.. you want to do analysis for moderator and mediator..also need a literature.. so..without literature,,i dont think researchers could write a good research paper..

May be ,,becoz lack of understanding in term of literature.. that's why.. they claimed that..there is no literature..

Saturday 1 November 2014

why choose PLS instead of others???

PLS is getting its momentum lately compare the other software in PLS... but still not many of us aware of that... every time i talked about PLS... many of them are asking... Why they have to use PLS instead of others.....

This is the problem of our researcher... they do know what they want to know.. not about they suppose to know..even our supervisor also... I just to share how to write your support your reason why we used PLS over the others...

PLS makes fewer demands regarding sample size than other methods.

 PLS does not require normal-distributed input data.

 PLS can be applied to complex structural equation models with a large number of constructs.

 PLS is able to handle both reflective and formative constructs.

 PLS is better suited for theory development than for theory testing.

 PLS is especially useful for prediction

all of that are based on the articel wrote by Urbach & Ahleman, 2010.

Hopefully this info will clear your mind about the reason why adopted PLS over other softwares...

Happy writing.....

Paper in SEM....

I am in the workshop with prof ramayah now... and he shared a very interesting story... there are researchers are writing the papers in SEM but still not sure how to write it in a proper way... i just wanna to share what should be wrote in the paper if researchers are using SEM either in AMOS and PLS..

1st... must settle the MEASUREMENT MODEL.. which is consist of  CONVERGENT AND DISCRIMINANT VALIDITY.. after you confirmed that those factors are valid .. that you can start the STRUCTURAL MODEL TESTING  which is consist of hypothesis testing... if not.. you paper..is CONFIRM .. will be REJECTED..

Friday 31 October 2014

Anova????

Last night , one of my friend called me to ask about how to test the comparison..... ermmm.. i told him that if there is only two group to be compared.. he can used a T-test if his data is normal.. and if more than 2.. he used apply the anova.... hahahahaa..sound likes the russian.. sharapova... navratilova.. dealova.. and many many lova..hahahhaa until we might be naik loya...

Ok.. since he asked me about anova.. this is an example about how to write the report for anova...

hopefully this will be helpful...

Three or four things to report


You will be reporting three or four things, depending on whether you find a significant result for your 1-Way Betwee Subjects ANOVA

1. Test type and use


You want to tell your reader what type of analysis you conducted. This will help your reader make sense of your results. You also want to tell your reader why this particular analysis was used. What did your analysis test for?

Example


You can report data from your own experiments by using the template below.

“A one-way between subjects ANOVA was conducted to compare the effect of (IV)______________ on (DV)_______________ in _________________,
__________________, and __________________ conditions.”

If we were reporting data for our example, we might write a sentence like this.

“A one-way between subjects ANOVA was conducted to compare the effect of sugar on memory for words in sugar, a little sugar and no sugar conditions.”

2. Significant differences between conditions


You want to tell your reader whether or not there was a significant difference between condition means. You can report data from your own experiments by using the template below.

“There was a significant (not a significant) effect of IV ____________ on DV ______________ at the p<.05 level for the three conditions [F(___, ___) = ___, p = ____].

Just fill in the blanks by using the SPSS output


Let’s fill in the values. You are reporting the degrees of freedom (df), the F value (F) and the Sig. value (often referred to as the p value).


Once the blanks are full…


You have a sentence that looks very scientific but was actually very simple to produce.

“There was a significant effect of amount of sugar on words remembered at the p<.05 level for the three conditions [F(2, 12) = 4.94, p = 0.027].”

3. Only if result of test was significant, report results of post hoc tests


In the previous chapter on interpretation, you learned that the significance value generated in a 1-Way Between Subjects ANOVA doesn’t tell you everything. If you find a significant effect using this type of test, you can conclude that there is a significant difference between some of the conditions in your experiment. However, you will not know where this effect exists. The significant difference could be between any or all of the conditions in your experiment. In the previous chapter, you learned that to determine where significance exists you need to conduct a post hoc test to compare each condition with all other conditions. If you have an IV with 3 levels, like the one in this example, you would need to conduct and report the results of a post hoc test to report which conditions are significantly different from which other conditions.

Example


Because we have found a statistically significant result in this example, we needed to compute a post hoc test. We selected the Tukey post hoc test. This test is designed to compare each of our conditions to every other conditions. This test will compare the Sugar and No Sugar conditions. It will also compare the A little sugar and No Sugar conditions. It will also compare the A Little Sugar and Sugar conditions.  The results of the Tukey post hoc must be reported if you find a significant effect for your overall ANOVA.

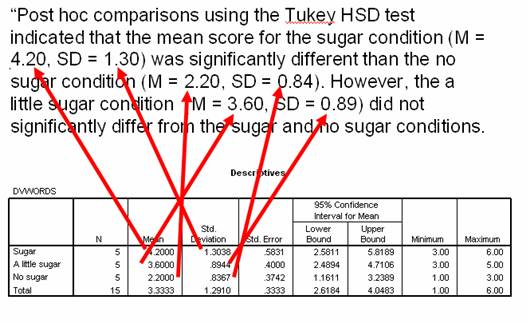
You can use the following template to report the results of your Tukey post hoc test. Just fill in the means and standard deviation values for each condition. They are located in your Descriptives box.


If you used this template with our example, you would end up with a sentence that looks something like this.

“Post hoc comparisons using the Tukey HSD test indicated that the mean score for the sugar condition (M = 4.20, SD = 1.30) was significantly different than the no sugar condition (M = 2.20, SD = 0.84). However, the a little sugar condition  (M = 3.60, SD = 0.89) did not significantly differ from the sugar and no sugar conditions.”

4. Report your results in words that people can understand


Since it might be hard for someone to figure out what that sentence means or how it relates to your experiment, you want to briefly recap in words that people can understand. Try to imagine trying to explain your results to someone who is not familiar with science. In one sentence, explain your results in easy to understand language.

Example


You might write something like this for our example.

“Taken together, these results suggest that high levels of sugar really do have an effect on memory for words. Specifically, our results suggest that when humans consume high levels of sugar, they remember more words. However, it should be noted that sugar level must be high in order to see an effect. Medium sugar levels do not appear to significantly increase word memory.”

This sentence is so much easier to understand than the scientific one with all of the numbers in it.

Let’s see how this looks all together


When you put the three main components together, results look something like this.

“A one-way between subjects ANOVA was conducted to compare the effect of sugar on memory for words in sugar, a little sugar and no sugar conditions. There was a significant effect of amount of sugar on words remembered at the p<.05 level for the three conditions [F(2, 12) = 4.94, p = 0.027]. Post hoc comparisons using the Tukey HSD test indicated that the mean score for the sugar condition (M = 4.20, SD = 1.30) was significantly different than the no sugar condition (M = 2.20, SD = 0.84). However, the a little sugar condition  (M = 3.60, SD = 0.89) did not significantly differ from the sugar and no sugar conditions. Taken together, these results suggest that high levels of sugar really do have an effect on memory for words. Specifically, our results suggest that when humans consume high levels of sugar, they remember more words. However, it should be noted that sugar level must be high in order to see an effect. Medium sugar levels do not appear to significantly increase word memory.”

Looks pretty complicated but it is simple when you know how to write each part.

Wednesday 29 October 2014

Results is not significant????

Have you ever counter this kind of situation????? Your results was not significant or even worse the relationship is negative?????? This scenario is the worst case scenario.. if you don't how to handle that... Just imagine... you hardly write your literature mentioned that there must be positively related or negatively related to your DV...   but the end.. the test wont support your hypothesis????

What should you do??? Adjust the literature??? OMG... that is terrible... adjust your data??? NO.. is is unethical... then???? End of your study??? That is disaster....

Don't worry dear... it also happend to me last time.. and i just wanna to cry thinking about that without any explanation....

Actually... that is the beauty of your study.., and believed me.. you will got more citation after this if your study are against from past studies... Am i kidding you ??? It is a bad JOKE?????

Nope.. it is true.. especially nowadays.. most of the students are looking to use a moderator for their study and while they wanna to use a moderating factor... there MUST be inconsistency in the literature.... SEE... now you gave them a great help ... now they can use the moderating factor because of your study..... hahahahahaha...

But.. before that.. when have this kind of results... you must argue and explain it logically base on your understanding the environment of your study according to the real situation.. only you know what is happening in your study.. if you could argue that.. it means you understood what are you studying about...

Foe example.... why a sky juice will cause you RM 5.90 in the 5 star hotel and it is only cost you 20 cents in the mamak stall and cost you nothing in a small stall????

If you understand the sutuation,.,... means that you know what are you study about....

Common Method Variance

It is quite a days that i did not up date my blog even there are few interesting questions have been asked by my colleagues... today i would like to share one of the most rare and interesting question... the explanation is quite long since a took a longer time to convince my friends about that...

It is about a common method variance.. my friend was sent his paper to the journal.. which is well known journal that i cant mention here.. one of the reviewer argued that.. since he used a single source data.. a common method variance (CMV) has not been addressed in his paper... how should this CMV should be address and write in the paper????

Wednesday 22 October 2014

Cronbach Alpha Vs Composire Reliability ( CA vs CR)

Yesterday i got inbox message from a my FB friend asking me about can we still use cronbach alpha (CA) to report the validity is we used SEM PLS as our software ?????...

Very good question and very bad understanding... as what malay always mentioned that... Water can not be mixed with oil..... ha hah ha.. what happend to the water when we mixed with oil??? Does it will mixed??? Well.. as all noticeed about that.. the answer is can not...

Now i will explain why we can not report CA idf we use SEM PLS... and why we need to report the Composire reliability (CR)... jeng ... jeng ..jeng..

CA is to check our internal consistency when we used SPSS as a software for analysis our data... AND... WE MUST USE THE CR IF WE USE SEM either AMOS or PLS.. coz AMOS and PLS are the second generation of analysis and using CR to test it internal consistency... SO...

if use SPSS = use CA for validty and if use PLS  or AMOS = CR for its validity.... ha ha as simple as that.. everything is created for certain approach ... but not for all....

Have a nive day....